
Many companies transitioning from an on-premise TM1 installation to IBM Planning Analytics (PA) on the cloud can face performance challenges. A common issue is the noticeable difference in refresh times for excel reports between their previous setup using Perspectives and the new PA on the cloud with PAfE (Planning Analytics for Excel).
A recent case study highlights a company experiencing report refresh times of 2-3 seconds on their on-premise TM1 setup, compared to 8+ seconds in PAfE on the cloud. Choosing Slice for TM1 for reporting performance in Excel can be extremely beneficial due to 3 main advantages that it offers over traditional TM1 excel add-ins.
- Improved Performance & Speed
Slice is built for high-performance reporting and handles large TM1 datasets efficiently. Reports refresh quickly, even with complex calculations and large datasets.
- Enhanced User Experience in Excel
Users can easily create and manipulate reports without deep knowledge of MDX. Since Slice integrates directly with Excel over WAN, users work within a familiar environment (very similar to perspectives).
- Enhanced Debugging & Development
Slice makes it simpler to troubleshoot and debug TM1 formulas in Excel. From cell audit and rule tracing to report auditing and logging enhancements can make the difference when tracking requests, identifying bottlenecks, and optimizing the refresh process.
In this blog, we’ll give you a couple of tips and show you how to use some of these features to improve the performance of your reports.
Here are some key recommendations to build fast Excel reports
- Find bottlenecks in your Excel reports
Slice comes with very handy auditing features.
- Audit report. This report will list all the cubes used in either the sheet and/or the entire workbook, the number of TM1 excel functions and the best practices violation so you can consider optimizing your report performance with best practices some mentioned in this blog.
- Detailed logging. Slice provides well-structured logs categorized by levels such as Debug, Info, Warn, and Error which you can enable/disable as you see fit. These log levels create a comprehensive audit trail in Slice that make a big difference when maintaining, troubleshooting, and optimizing excel reports.
- DBR vs. DBRW
- DBR formulas trigger separate requests to the server for each cell. Replacing DBRs with DBRWs can help consolidate requests improving performance.
By creating a report that contains only DBR formulas and simply replacing them with DBRWs, we can see performance improvements, in this example we reduced the refresh time from 6secs down to 1sec.

- Managing SUBNMs
- Ensure SUBNMs are used correctly. In some cases, these formulas can be unnecessary or invalid. Since each SUBNM generates a separate request to TM1, removing them can significantly reduce overhead. The TM1ELLIST formula can be a better alternative for handling element lists efficiently.
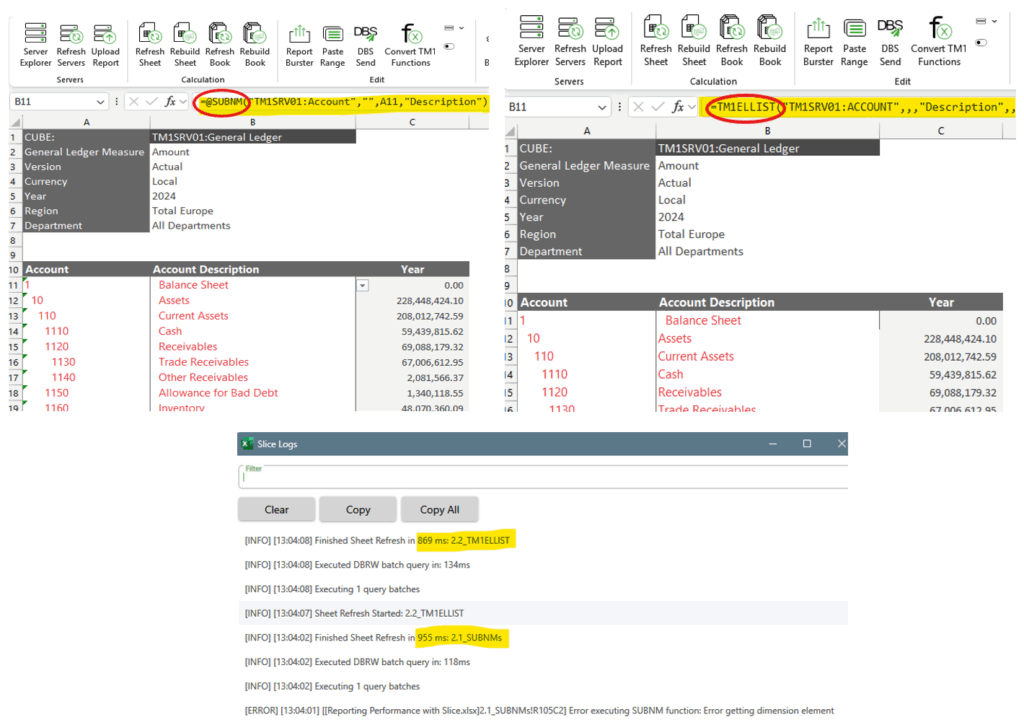
In the example below, we can see that it took 955ms for the sheet 2.1_SUBNMs to refresh, we can also see that there are some SUBNM formulas with errors. After clearing these errors and replacing the SUBNM formulas with TM1ELLIST we can see the report took 869ms. Surely the difference here is in milliseconds, nevertheless with larger datasets this can make a difference.
- Arithmetic operations with DB* formulas
- Look for DBR and/or DBRW formulas that have arithmetic operations, this does not allow batch requests to the TM1 server and can add unnecessarily single multiple requests, therefore adding to the refresh time. A good alternative can be handling the arithmetic operation in a separate cell.
- Reduce Unnecessary Requests due to Multiple DBRW, DBHW, DBR, DBH in a cell
- In most cases, nested DBRWs cannot be batched due to dependencies between them. Reports should aim to be designed to allow DBRWs to be grouped into a single request whenever possible to ensure optimal performance.
- Symmetric views and Cleaning Up Invalid Cells
- Try to use symmetric views as much as possible. These views are a way of displaying data where different possible combinations of selected elements are included in the view, whether it’s on the rows or columns. This contrasts with asymmetrical views, which allow you to selectively include or exclude specific members or combinations of members.
- The presence of #REF leads to unnecessary processing time. By addressing these errors, refresh times can be reduced significantly.
Key Takeaways
- Optimizing Report Structure is Critical: In the new world without Perspectives, ensuring DBRWs are grouped efficiently can significantly reduce refresh times.
- Eliminate Unnecessary Elements: Reducing SUBNMs, redundant DBRAs, and invalid references can prevent excessive server requests.
- Use the Right Tools for Testing: Slice auditing tools are extremely useful for identifying slow queries before deploying changes.
- Stay Up to Date: Keeping software updated ensures better performance and access to enhanced features.
By following this structured approach, companies can successfully bridge the performance gap between their on-premise TM1 setup and the cloud-based Planning Analytics, achieving a seamless and efficient transition.
Need help optimising your TM1 reports? Let’s connect! 🚀
Leave a Reply