Category: Help
-

Run processes in parallel using only one TM1 connection
Being able to run processes in parallel is one of the most powerful features of IBM TM1 and Planning Analytcs. Instead of loading one year of data with one process, you could run in parallel one process per month which will significantly speed up your loading time!
-
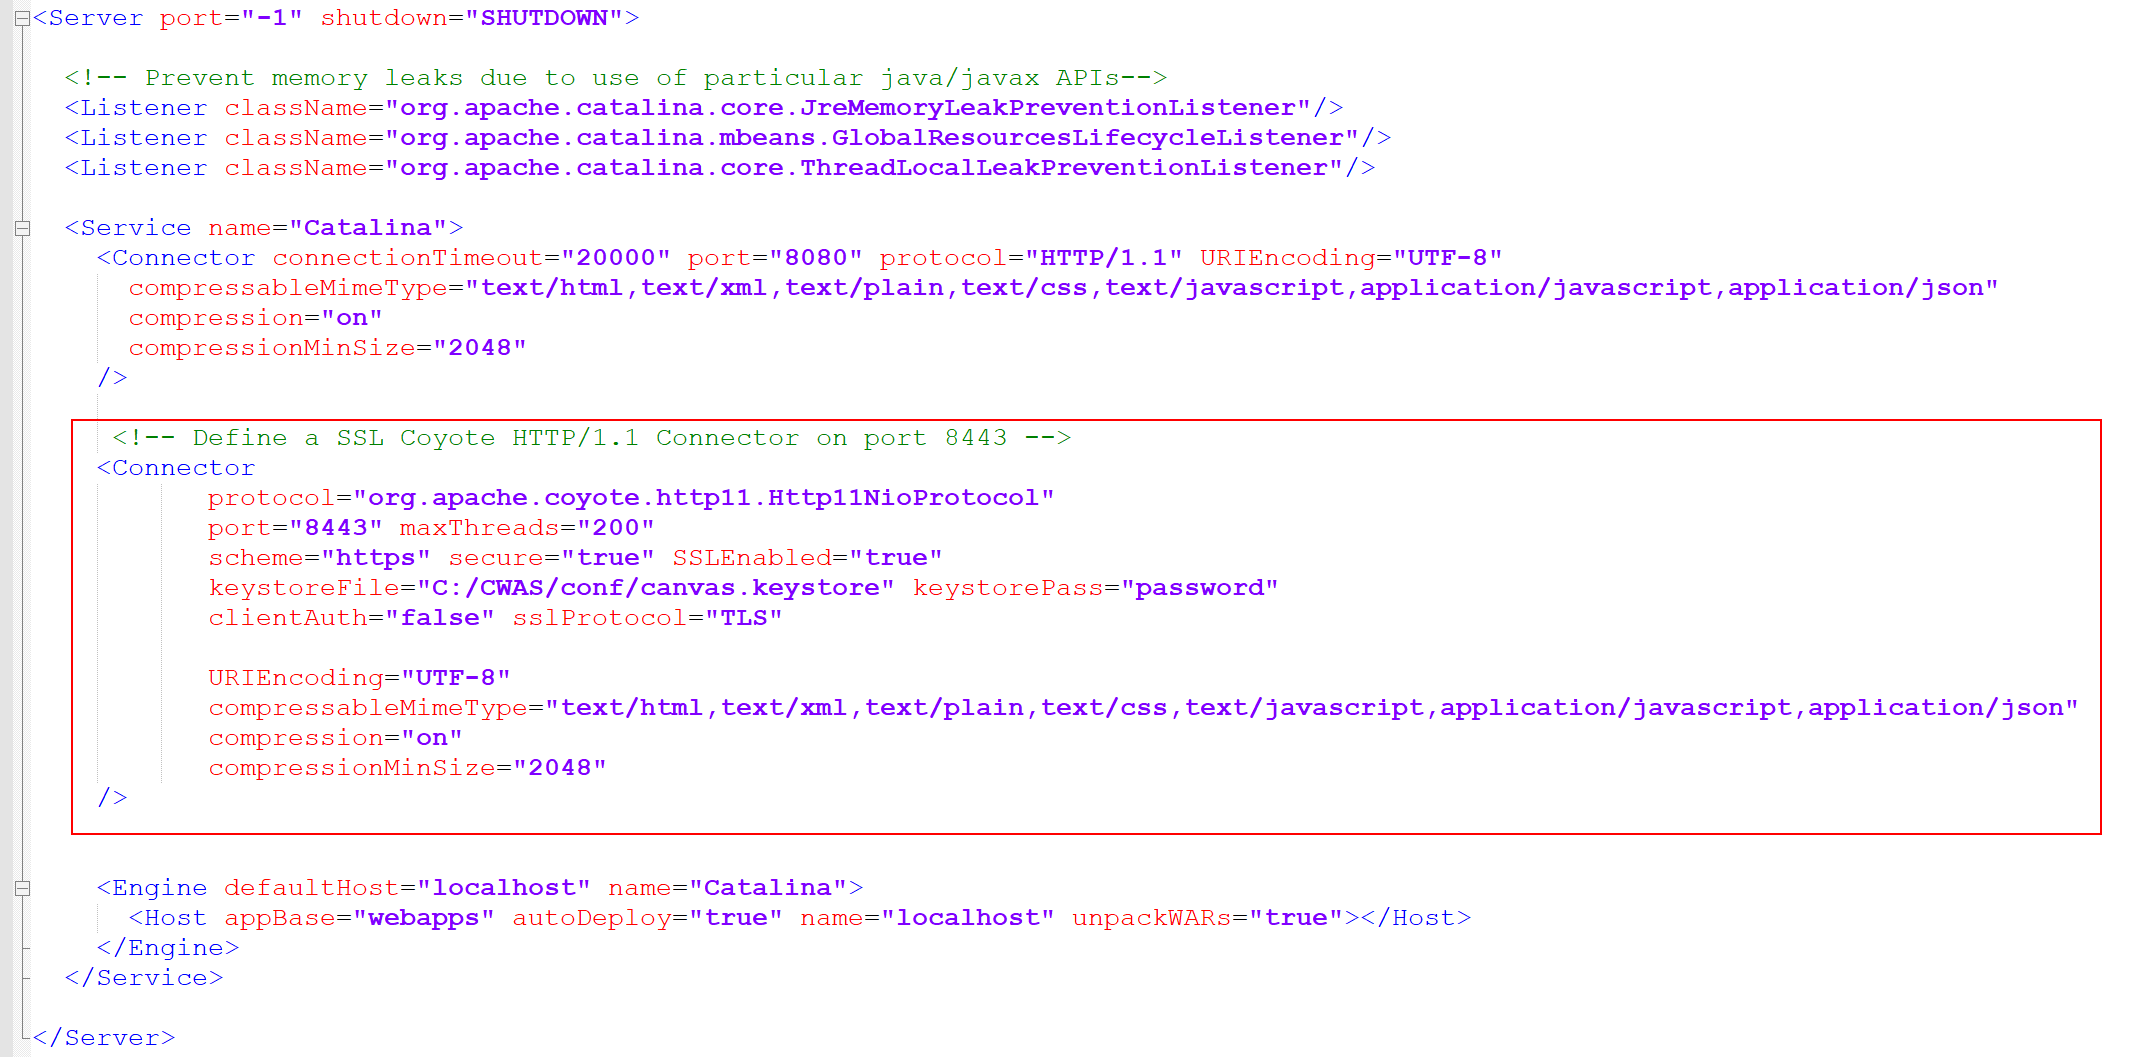
Using SSL with Canvas
You will need to add the following code between <Service and <Engine section:
-
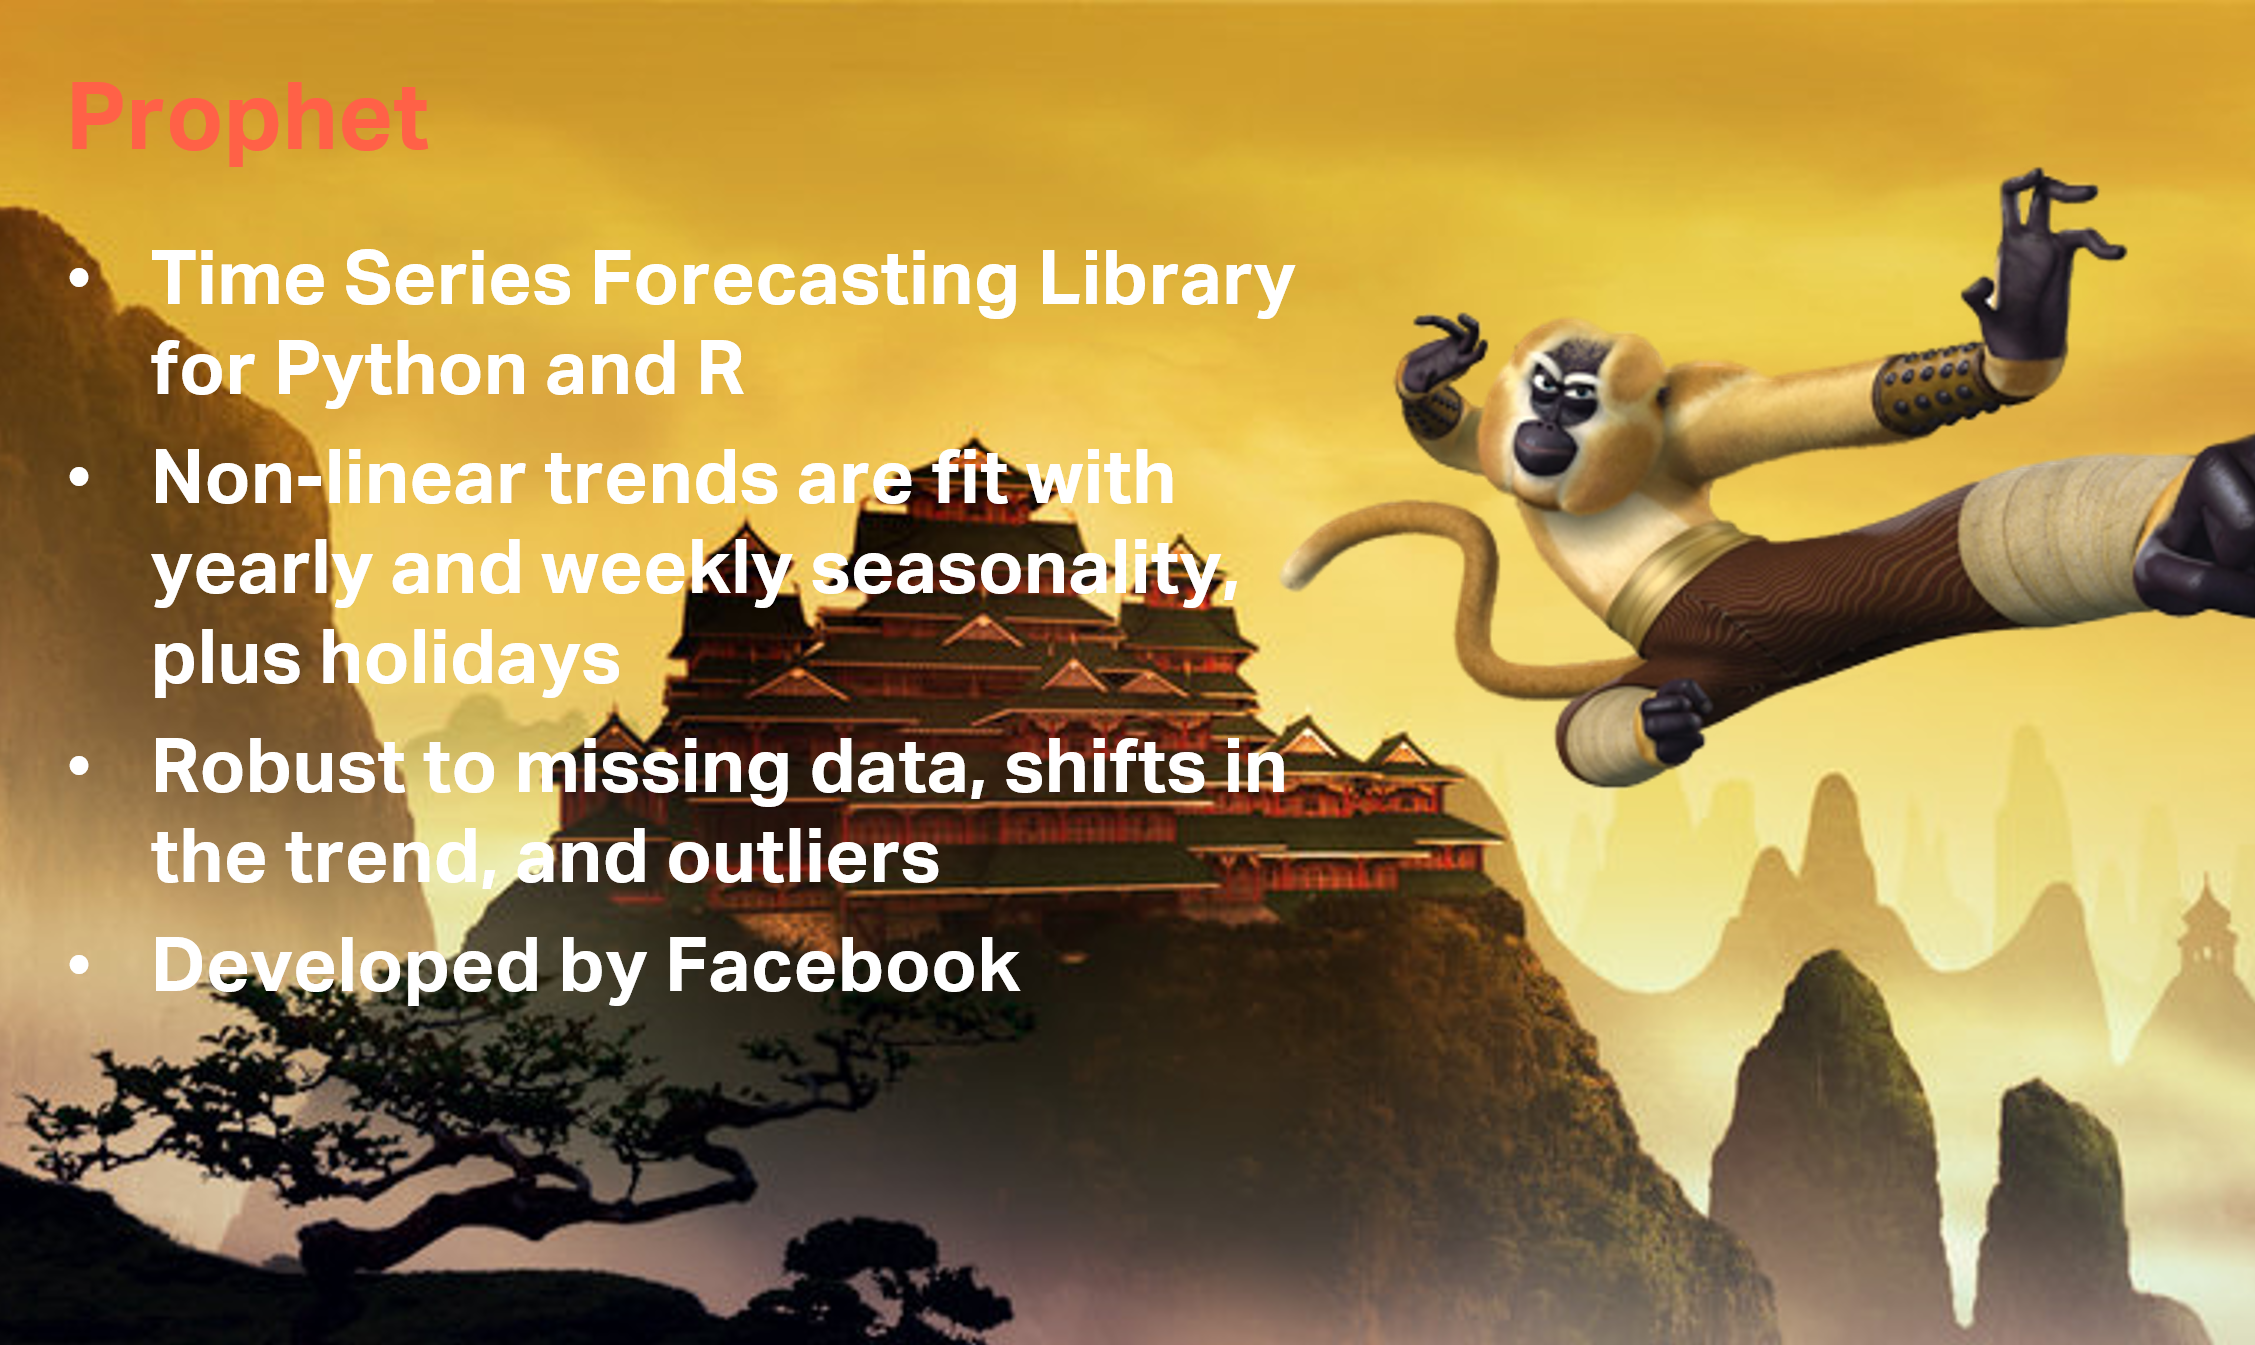
Automate your daily forecast with Prophet
What is Prophet?
-
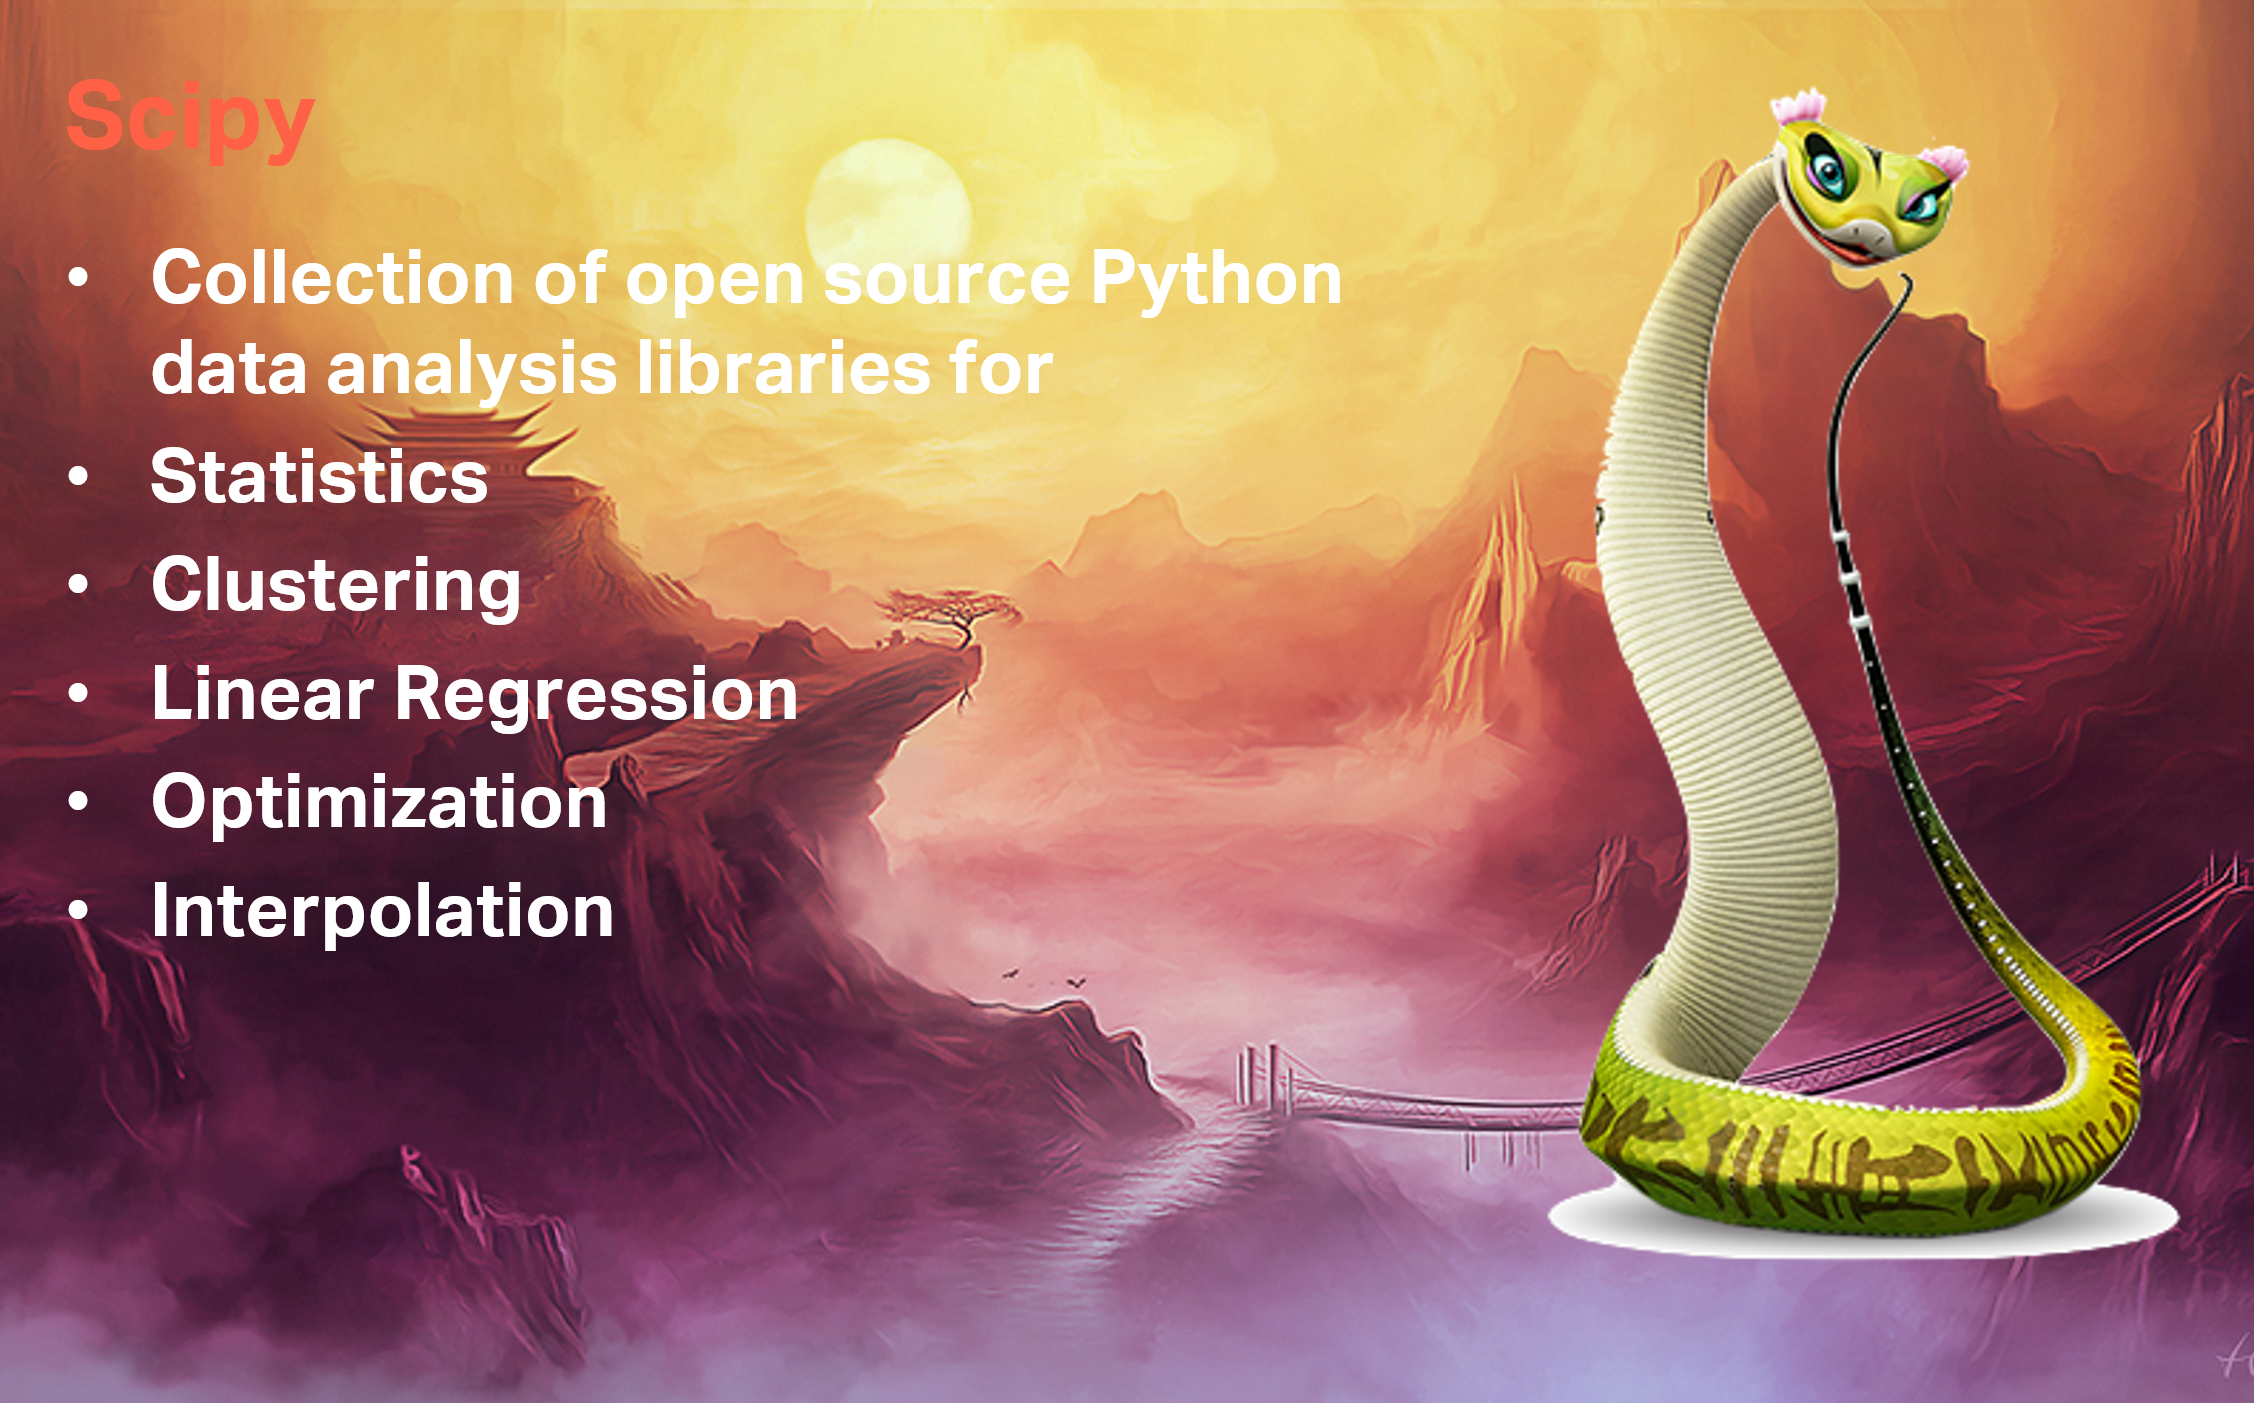
Optimization with TM1 and Planning Analytics
What is Scipy?
-

Classification and Regression with Scikit-Learn and TM1
A very good example has been done by one of our colleague Nicholas Renotte, you can find all the step through in this blog post:
-
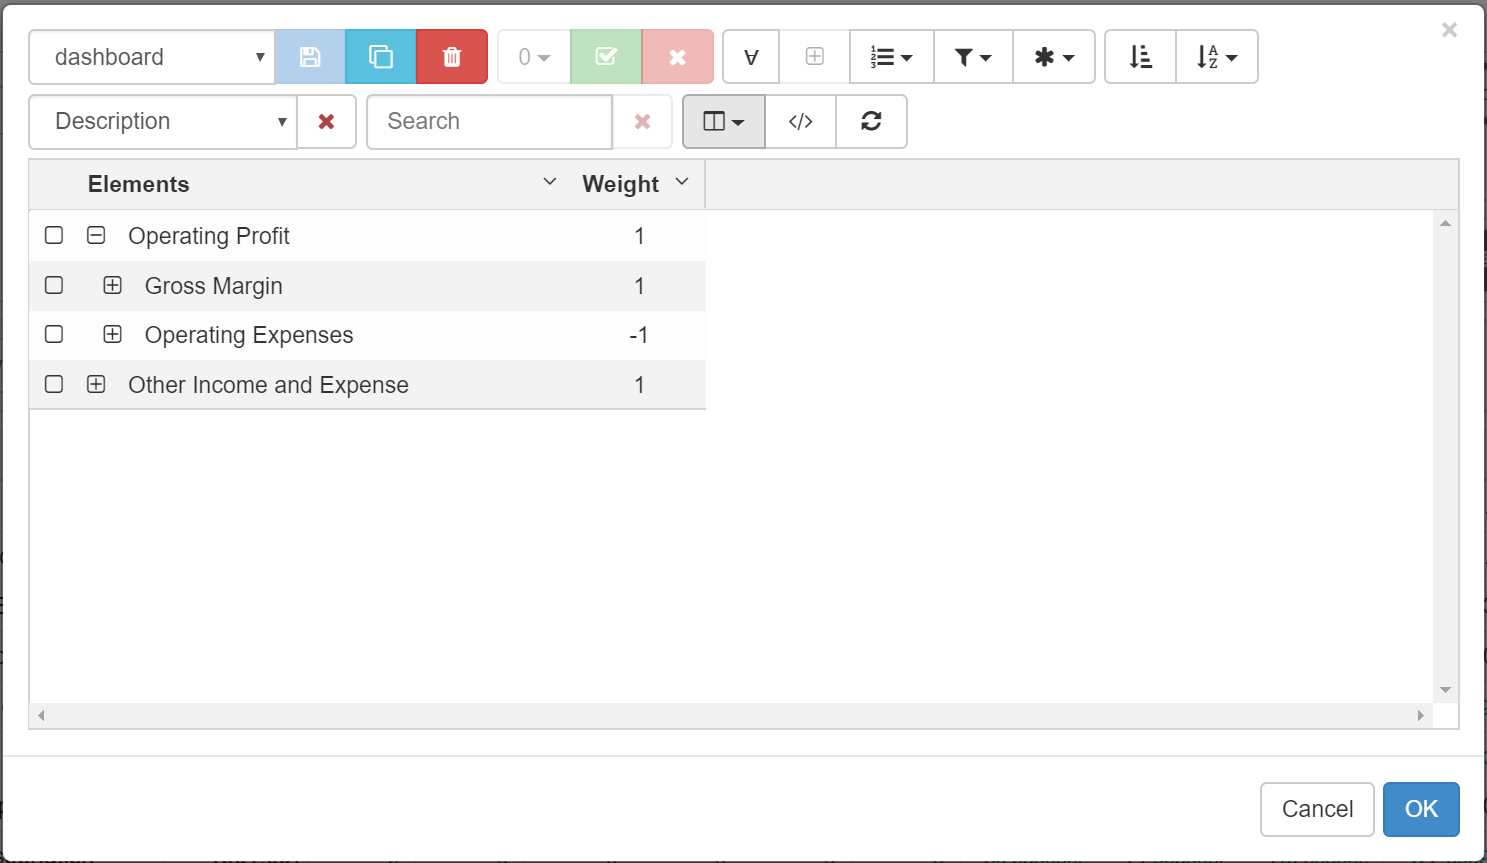
Using the Canvas subset editor
Like the cube viewer, the Canvas subset editor (introduced in v3.0.1), is built to generate MDX set expressions. Most of the functionality should be familiar to what you have experienced in Architect or Perspectives: all elements, filtering, ordering, etc.
-
Using the Canvas cube viewer
Canvas v3.0.1 introduces a new cube viewer to explore your cubes. The new cube viewer supports both native and MDX views.
-

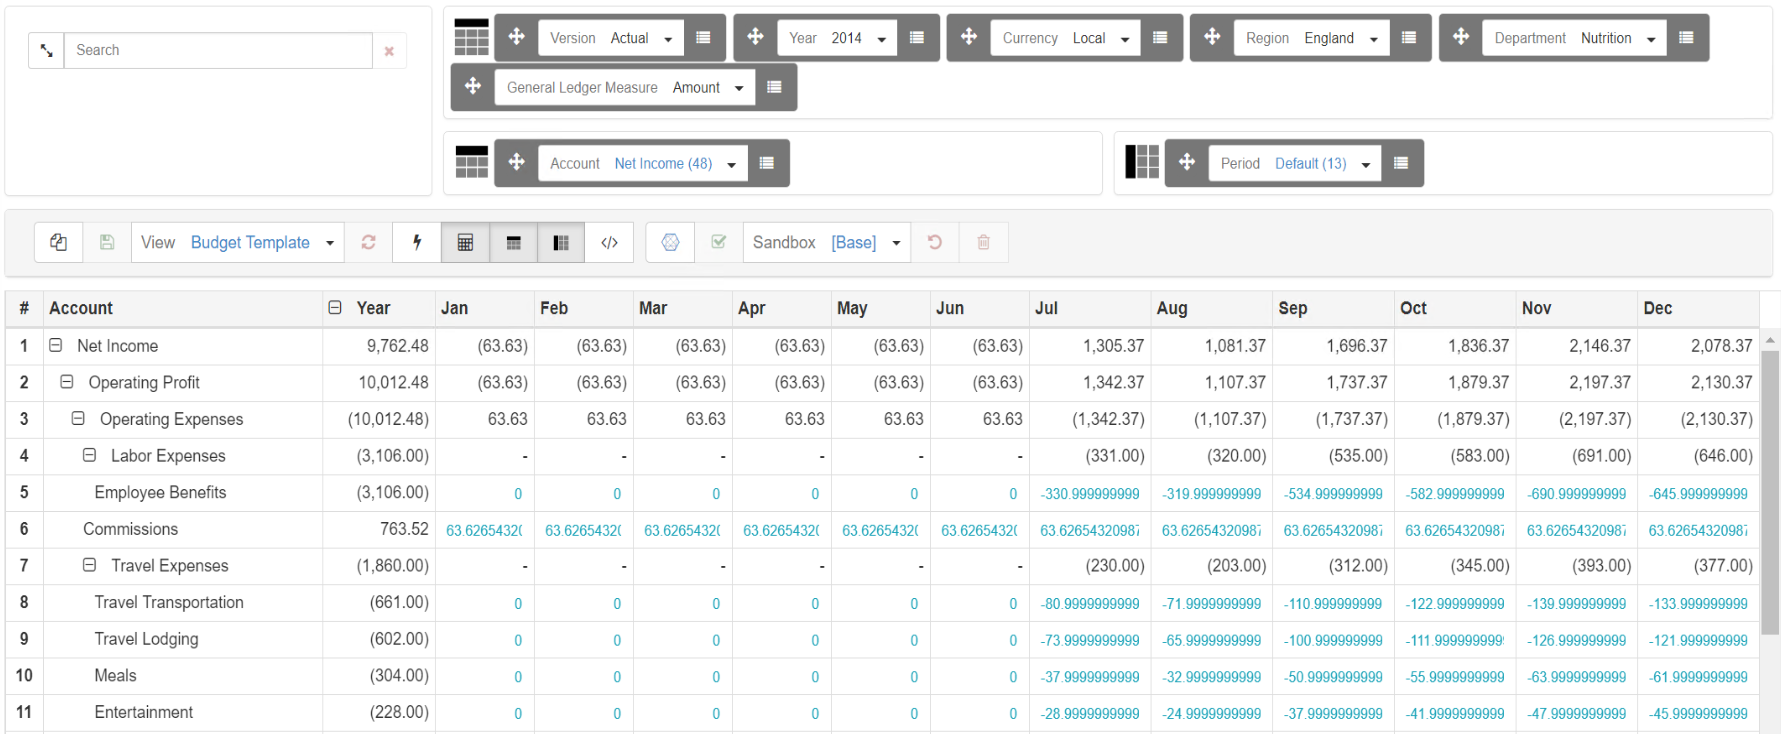
Using Sandbox with Canvas
A sandbox is your personal workspace where you can write data without interferring the base data. Canvas v3.0.1 introduces support to TM1 and Planning Analytics sandbox. All sandbox’s operation are now available in Canvas such as Create, Publish, Discard or Delete:
-
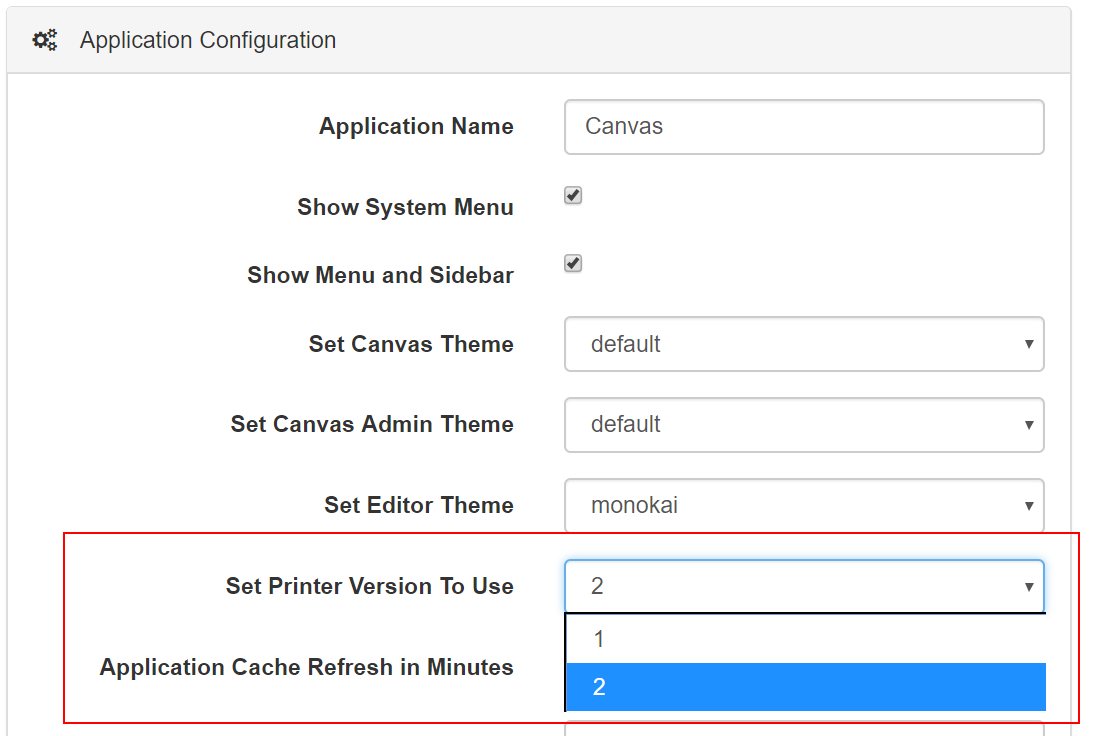
Set Printer Version to Use mode 2
Canvas v3 introduced a new printer version. By default, Canvas will now use this new printer version but if you prefer to go back to the first version of the printing you can change the printer version in your application Admin section:
-
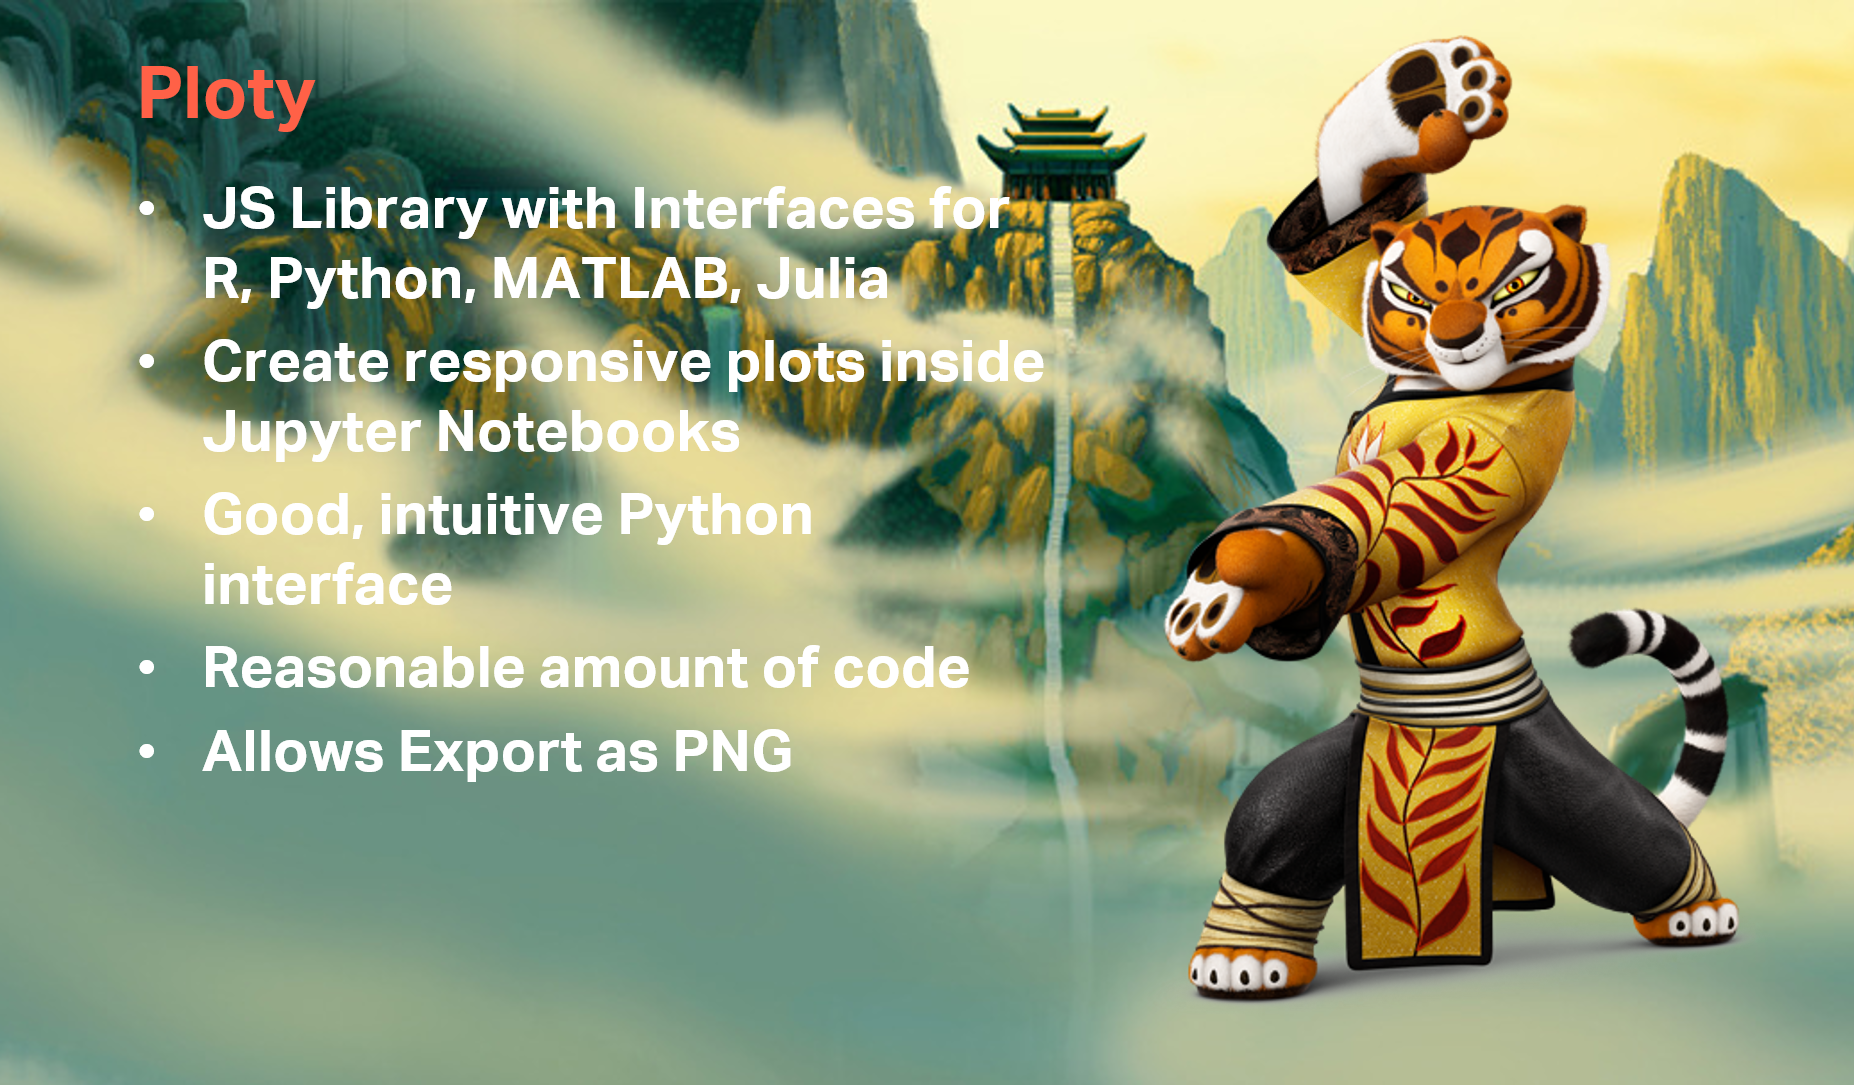
Create responsive plot chart with Ploty
What is Ploty?