Category: Canvas
-
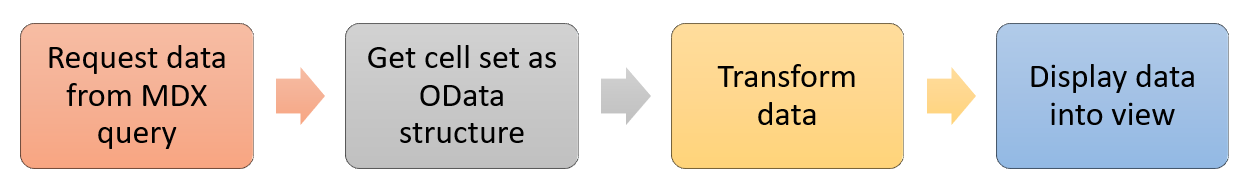
Transform your cell set into a structured format
Canvas comes with lots of directives which are ready to use. For example with tm1-ui-dbr you can quickly request a data from TM1 and display it in your page. With these directives you can already achieve a lot but in certain case where you want to do more customization, you can use Canvas services such…
-
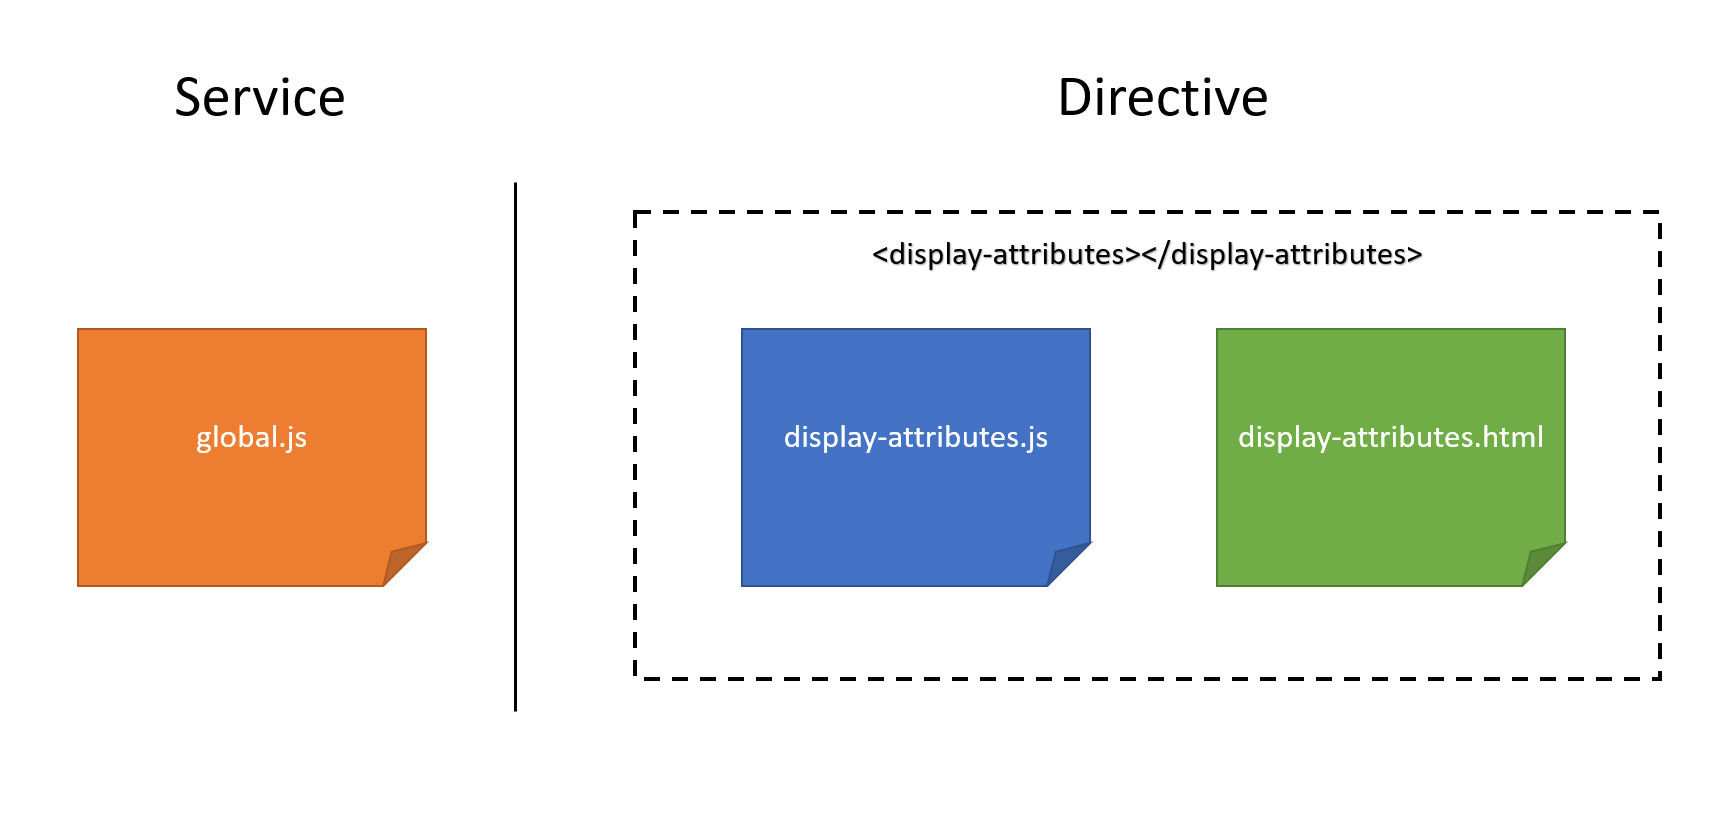
How to build your own service
In AngularJS, a service is a function, or an object, that is available for, and limited to, your application. AngularJS has about 30 built-in services. If you are updating the URL in your application, it is likely that you have already used the $location service.
-
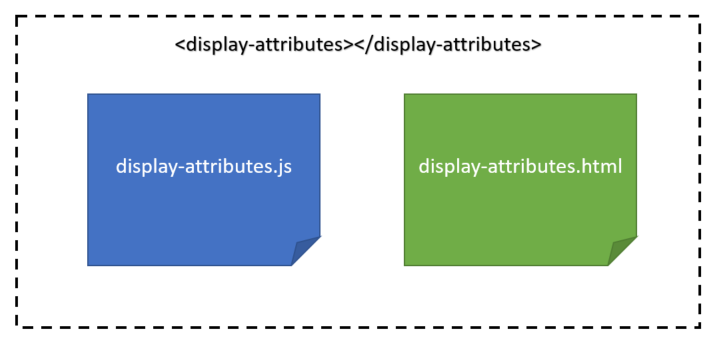
How to build your own directive
Canvas for TM1 comes with 30 directives (tm1-ui-dbr, tm1-ui-subnm…) which will help you to build quickly a page. If you combine these Canvas directives with the AngularJS Directives such as ng-repeat and ng-if, you can already achieve a lot. By combining these existing directives, you can build more sophisticated components. When you start replicating the same…
-
How Cubewise Code will shape the future of IBM TM1/Planning Analytics in 2018
A lot happened in the TM1/Planning Analytics world in 2017. Canvas has been endorsed by many customers as their new way to build modern web planning and reporting applications. TM1py brought together for the first time, the TM1 and Python communities in order to find new ways to integrate external systems with your TM1 application.
-
How Cubewise CODE has revolutionized TM1 Planning Analytics in 2017
A lot happened in 2017 in the IBM Planning Analytics (TM1) world. Here is a quick recap from Cubewise CODE.
-

The differences between IBM Planning Analytics Workspace and Canvas
The world has changed, user experience is now the most decisive factor in the success of any business application that is built for people, and TM1-based applications are no exception. Despite inferior modelling capability and performance, other (non-TM1) software solutions have become popular almost solely on the fact that they meet modern user expectations for user experience.
-

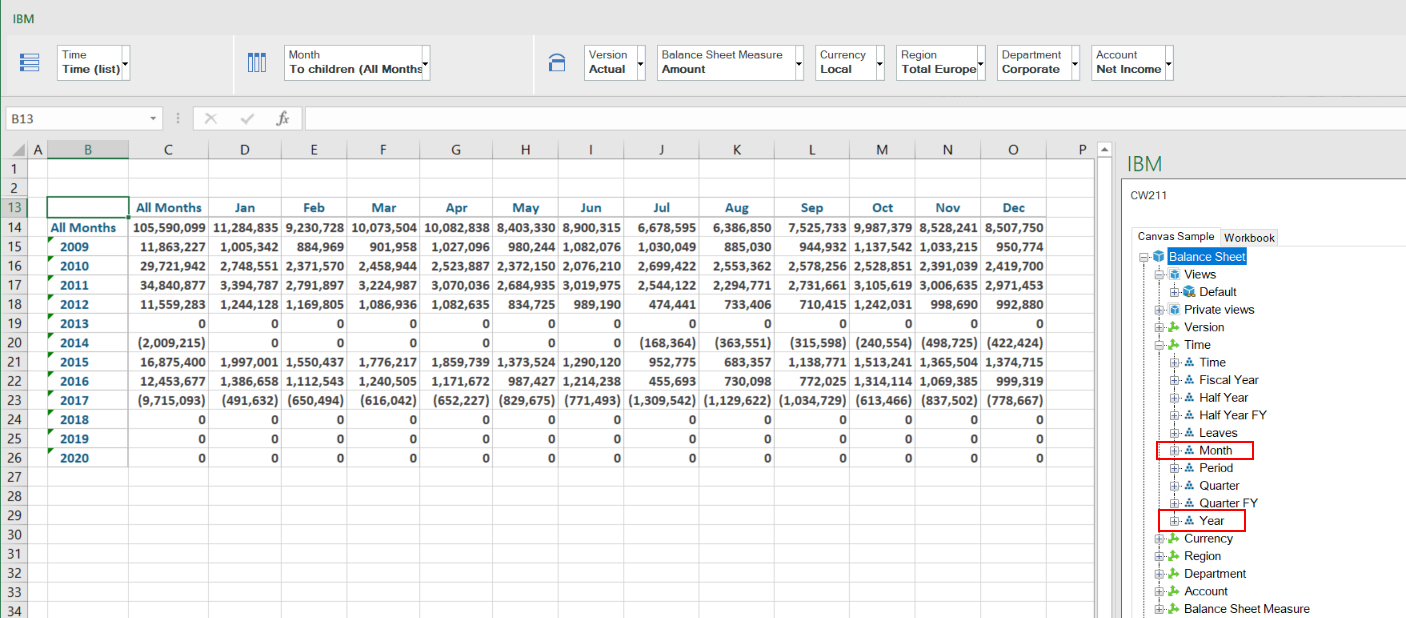
Rebuild your TM1 Active Forms with Alternate Hierarhies
The most exiting feature of IBM Planning Analytics is Alternate hierarchy! With alternate hierarchy you will be able to reduce the number of dimensions in your cubes. You don’t need to choose between added an attribute or a dimension. Now all atributes can be seen as an alternate hierarchy.
-
Canvas v2 Released
The unique IBM TM1/Planning Analytics REST API framework just got even better! Some of the highlights of the great new features of Canvas version 2 below.
-
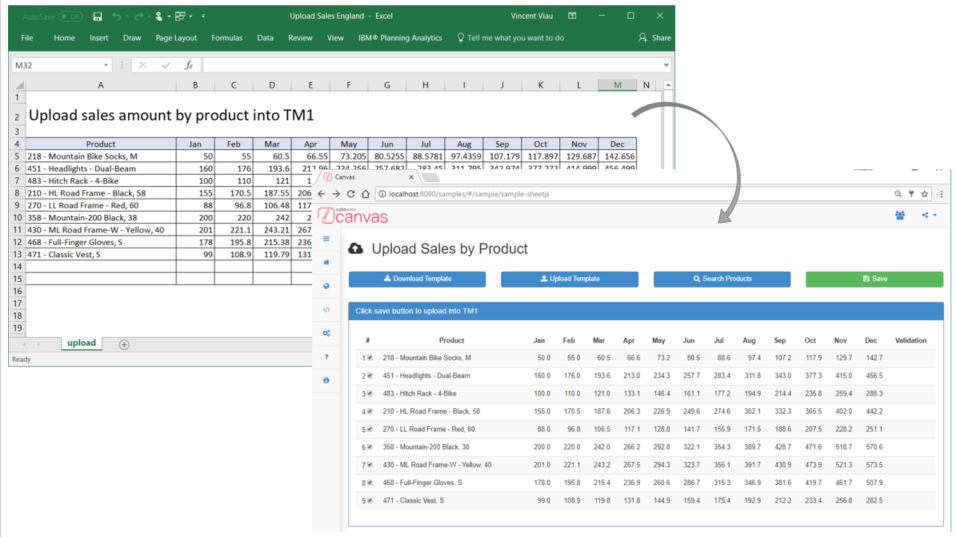
Display data from an Excel file and then send it to TM1 via REST API
With Canvas, you can upload an Excel file into your browser, validate the data and then send the data into TM1 using the REST API. A sample showcasing has been introduced in Canvas 2.0:
-
Alternate Hierarchies in Canvas
Probably the most exiting feature in IBM Planning Analytics is alternate hierarchies. Using alternate hierarchies will enable you to potentially reduce the number of dimensions in your cube and therefore improve cube size and performance.